Topics in this domain
- IT Governance vs. IT Management
- Board and Senior Management Roles
- IT Steering Committee
- IT Strategy and Business Alignment
- Balanced Scorecard
- COBIT
- ITIL
- ISO 27001/27002
- COSO: ERM and Internal Control
- Policies, Standards, Procedures, Guidelines
- IT Organizational Structure and Key Roles
- Segregation of Duties in IT
- Enterprise Architecture (Zachman, TOGAF)
- Risk Management Process
- Qualitative vs. Quantitative Risk Assessment
- Risk Responses: Mitigate, Transfer, Avoid, Accept
- Risk Appetite and Residual Risk
- Maturity Models (CMMI)
- KPIs and KGIs
- Outsourcing: Benefits and Risks
- Vendor Selection, Contracts, SLAs, Right to Audit
- Cloud and Offshore Governance
- Portfolio and Resource Management
- HR: Hiring, Training, Termination
- Legal and Regulatory Compliance
- Quality Management
Qualitative vs. Quantitative Risk Assessment
Two ways to size a risk
Ask two people how worried to be about a house fire. One says “low chance, but terrible if it happens”. The other says “about a 0.3% chance each year, costing roughly 300,000 if it does”. The first is a qualitative assessment; the second is quantitative. Both are useful, for different jobs.
Qualitative
Likelihood and impact are rated on descriptive scales such as high, medium and low, and often shown on a heat map.
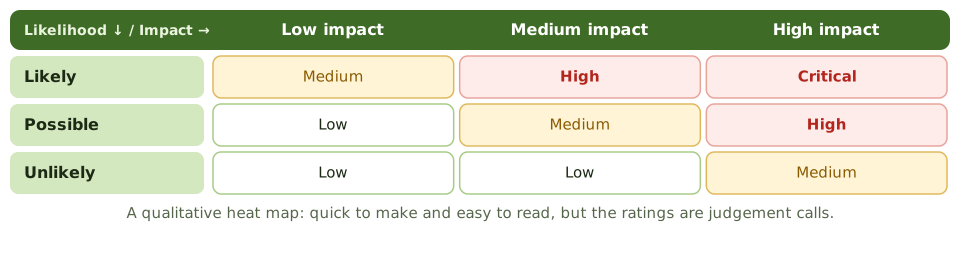
- Advantages: quick, easy to understand, doesn’t need detailed data, good for ranking lots of risks.
- Disadvantages: subjective; different people rate the same risk differently; no basis for comparing cost and benefit directly.
It’s the most common approach, especially for IT and security risks where reliable loss data is rare.
Quantitative
Money values and probabilities are assigned to each risk. Five terms do all the work:
| Term | Meaning |
|---|---|
| Asset value (AV) | What the asset is worth |
| Exposure factor (EF) | The percentage of the asset’s value lost in one event |
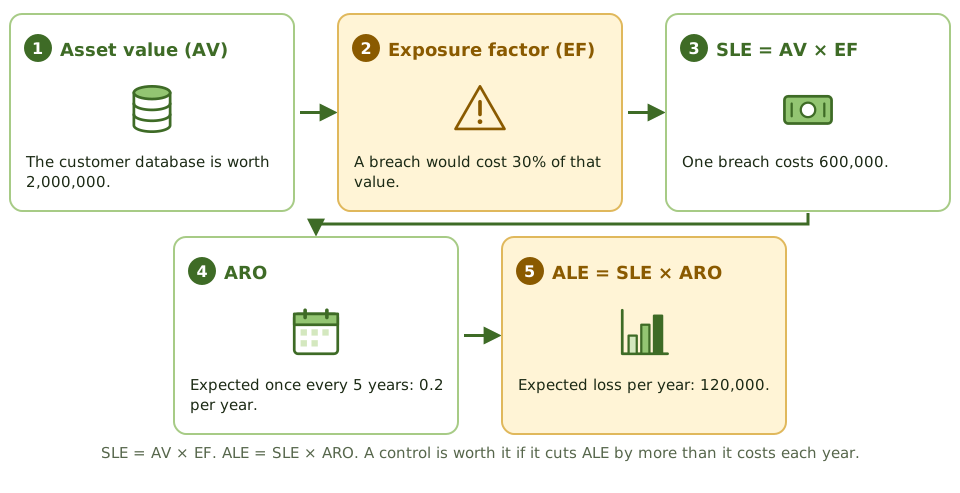
| Single loss expectancy (SLE) | AV × EF: the cost of one event |
| Annualised rate of occurrence (ARO) | How many times a year it’s expected to happen (0.2 = once every five years) |
| Annualised loss expectancy (ALE) | SLE × ARO: the expected loss per year |
Is a control worth it?
Value of a control = ALE before − ALE after − yearly cost of the control. If the answer is positive, the control pays for itself.
Worked example. A customer database is worth 2,000,000. A breach would cost 30% of that (EF), so SLE = 600,000. A breach is expected once every five years (ARO = 0.2), so ALE = 120,000 a year. A data loss prevention tool costs 40,000 a year and would cut the ARO to 0.05 (once in 20 years). New ALE = 30,000. It saves 90,000 a year in expected losses for a cost of 40,000: a net benefit of 50,000. Worth it.
- Advantages: supports cost-benefit decisions and budget requests; results are comparable.
- Disadvantages: needs reliable data that often doesn’t exist; takes time; precise-looking numbers can hide rough guesses.
Semi-quantitative
Numbers (for example 1 to 5) are assigned to qualitative ratings and multiplied to rank risks. It gives a more consistent ranking than pure qualitative ratings, but the numbers aren’t real money values: a risk scoring 20 isn’t “twice as bad” as one scoring 10.
Choosing an approach
- Lots of risks, little data, need to prioritise quickly: qualitative or semi-quantitative.
- A specific investment decision, with loss data available: quantitative.
- Often both: a qualitative screen first, then quantitative analysis of the top risks.
How the exam asks about it
| If the question asks… | The answer is usually… |
|---|---|
| Formula for ALE | SLE × ARO |
| Formula for SLE | Asset value × exposure factor |
| Main advantage of quantitative analysis | It supports cost-benefit analysis of controls |
| Main disadvantage of quantitative analysis | Reliable data is hard to obtain |
| Main disadvantage of qualitative analysis | Subjectivity |
| When a control is cost-justified | The reduction in ALE exceeds its yearly cost |
In short
- Qualitative analysis rates likelihood and impact on scales like high, medium and low. Quick and common, but subjective.
- Quantitative analysis uses money and probabilities. It supports cost-benefit decisions but needs reliable data.
- Single loss expectancy: SLE = asset value × exposure factor.
- Annualised loss expectancy: ALE = SLE × annualised rate of occurrence (ARO).
- A control is worth it when the drop in ALE is bigger than the control's yearly cost.
- Semi-quantitative analysis puts numbers on qualitative scales for ranking, without real money values.
Exam traps
- Exposure factor is the share of the asset's value lost in ONE event, not a probability.
- ARO is how often per year: 0.1 means once in ten years.
- Quantitative results look precise but are only as good as the estimates behind them.
- Qualitative isn't wrong; it's the normal approach when data is scarce.
Slides
Click the slide and use the arrow keys. F toggles full screen.
Qualitative
Likelihood and impact are rated on simple scales and often shown as a heat map. Quick, easy to explain, and fine when there's little hard data. The catch: the ratings are judgement calls.
Quantitative, step by step