Topics in this domain
- Project Roles and Governance
- PMBOK Phases
- Gantt, PERT, Critical Path
- Function Point Analysis
- Earned Value and Project Risk
- Business Case and Feasibility
- Benefits Realization
- SDLC Phases Overview
- Requirements Definition
- System Design
- Waterfall vs. Iterative vs. Prototyping
- Agile
- DevOps and DevSecOps
- RAD, CASE, Low-Code
- Build, Coding Standards, Code Review
- Testing Levels: Unit, Integration, System, UAT
- Regression, Sociability, Parallel, Pilot Testing
- Defect Management
- Data Migration and Conversion
- Change-Over: Parallel, Phased, Abrupt
- Go-Live Readiness and Acceptance
- Post-Implementation Review
- Input Controls
- Processing Controls
- Output Controls
- Data Integrity and ACID
- EDI and E-Commerce Controls
Earned Value and Project Risk
Spending isn’t progress
“We’ve spent half the budget and we’re halfway through the schedule.” It sounds fine. But what if only a third of the work is actually done?
Paying a decorator half the fee doesn’t mean half the house is painted. You’d go and look at the walls. Earned value is the project manager’s way of looking at the walls.
Earned value management (EVM) brings scope, schedule and cost together, answering: how much work have we really done, compared with the plan and with what we’ve spent?
Three numbers
| Term | Meaning |
|---|---|
| Budget at completion (BAC) | The total approved budget |
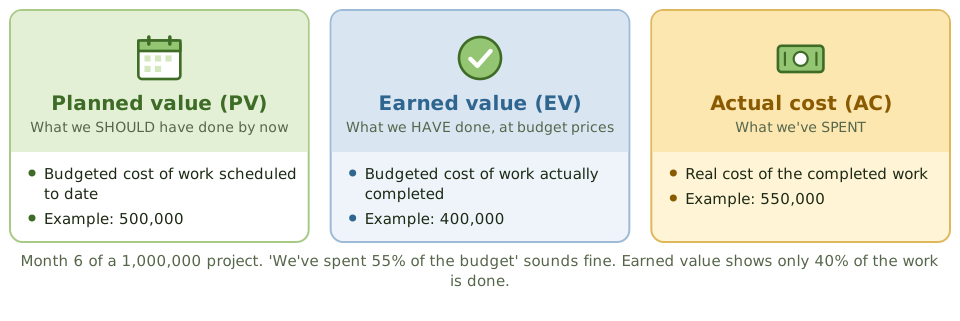
| Planned value (PV) | The budgeted cost of the work scheduled to be done by now |
| Earned value (EV) | The budgeted cost of the work actually done by now |
| Actual cost (AC) | What the work done so far actually cost |
Reading the results
| Indicator | Formula | Bad news when… |
|---|---|---|
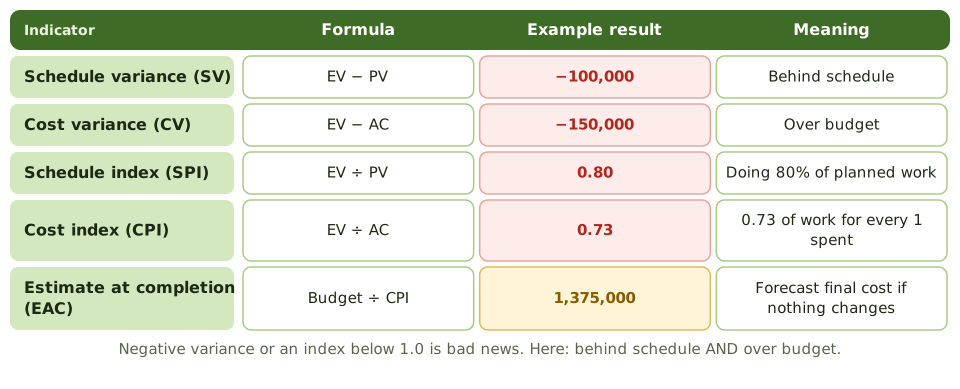
| Schedule variance | SV = EV − PV | Negative: behind schedule |
| Cost variance | CV = EV − AC | Negative: over budget |
| Schedule performance index | SPI = EV ÷ PV | Below 1: behind schedule |
| Cost performance index | CPI = EV ÷ AC | Below 1: over budget |
| Estimate at completion | EAC = BAC ÷ CPI | Above the budget: forecast overrun |
Worked example. The budget is 1,000,000. At month 6, PV is 500,000, EV is 400,000 and AC is 550,000. SV = −100,000 (behind schedule). CV = −150,000 (over budget). SPI = 0.80. CPI = 400,000 ÷ 550,000 ≈ 0.73. If cost performance doesn’t improve, EAC = 1,000,000 ÷ (400,000 ÷ 550,000) = 1,375,000. Meanwhile the status report says “55% of budget spent”, which hides that only 40% of the work is done.
Managing project risk
Project risks threaten scope, schedule, cost, quality or benefits. Managing them follows the general risk process:
- Identify risks early and keep doing so: workshops, checklists, lessons from past projects.
- Assess how likely and how damaging each is.
- Plan responses: avoid, mitigate, transfer or accept, with contingency reserves.
- Assign owners.
- Monitor through a risk register reviewed at steering meetings.
Common project risks: unclear or changing requirements, weak sponsor or user involvement, unrealistic estimates, reliance on one key person, new technology, vendor performance, complex integration, and data conversion.
What the auditor looks for
- progress measured by work done (earned value or similar), not by spending
- baselines changed only through approved change control
- a maintained risk register with owners and actions
- big variances escalated to the steering committee
- independent quality reviews at key milestones
How the exam asks about it
| If the question asks… | The answer is usually… |
|---|---|
| The best measure of project progress | Earned value: work done compared with the plan and cost |
| SPI of 0.8 means | Behind schedule (80% of the planned work done) |
| CPI below 1.0 means | Over budget for the work done |
| Formula for cost variance | EV − AC |
| When project risks are assessed | Throughout the project |
In short
- Earned value management compares planned value (PV), earned value (EV) and actual cost (AC) to measure schedule and cost performance.
- Schedule variance = EV − PV; cost variance = EV − AC. Negative means behind schedule or over budget.
- SPI = EV ÷ PV and CPI = EV ÷ AC. Below 1.0 is bad.
- Estimate at completion is often budget ÷ CPI: today's cost performance projected to the end.
- Project risks are identified early, rated, given owners and responses, and tracked in a risk register.
- Money spent says nothing about progress; earned value ties spending to work actually done.
Exam traps
- A project that has spent 50% of its budget isn't necessarily 50% complete.
- Positive variance is good; an index above 1.0 is good.
- Earned value is the BUDGETED cost of work done, not the actual cost.
- Project risk management is continuous, not a one-off at the start.
Slides
Click the slide and use the arrow keys. F toggles full screen.
Three numbers
Reading the results